Thermal Sleuth
A pipeline that flags industrial thermal discharge in EU waters from Sentinel-3 satellite data, scores confidence, and serves it through a REST API — built at the CASSINI Hackathon.
The prompt
CASSINI Hackathon 2025 — the challenge was to build something useful on top of Copernicus/Sentinel satellite data. Our team of five went after industrial thermal discharge into EU waters: heat runoff from power plants and industrial sites, visible in thermal satellite bands, that matters for the ecosystems downstream of it.
What we built
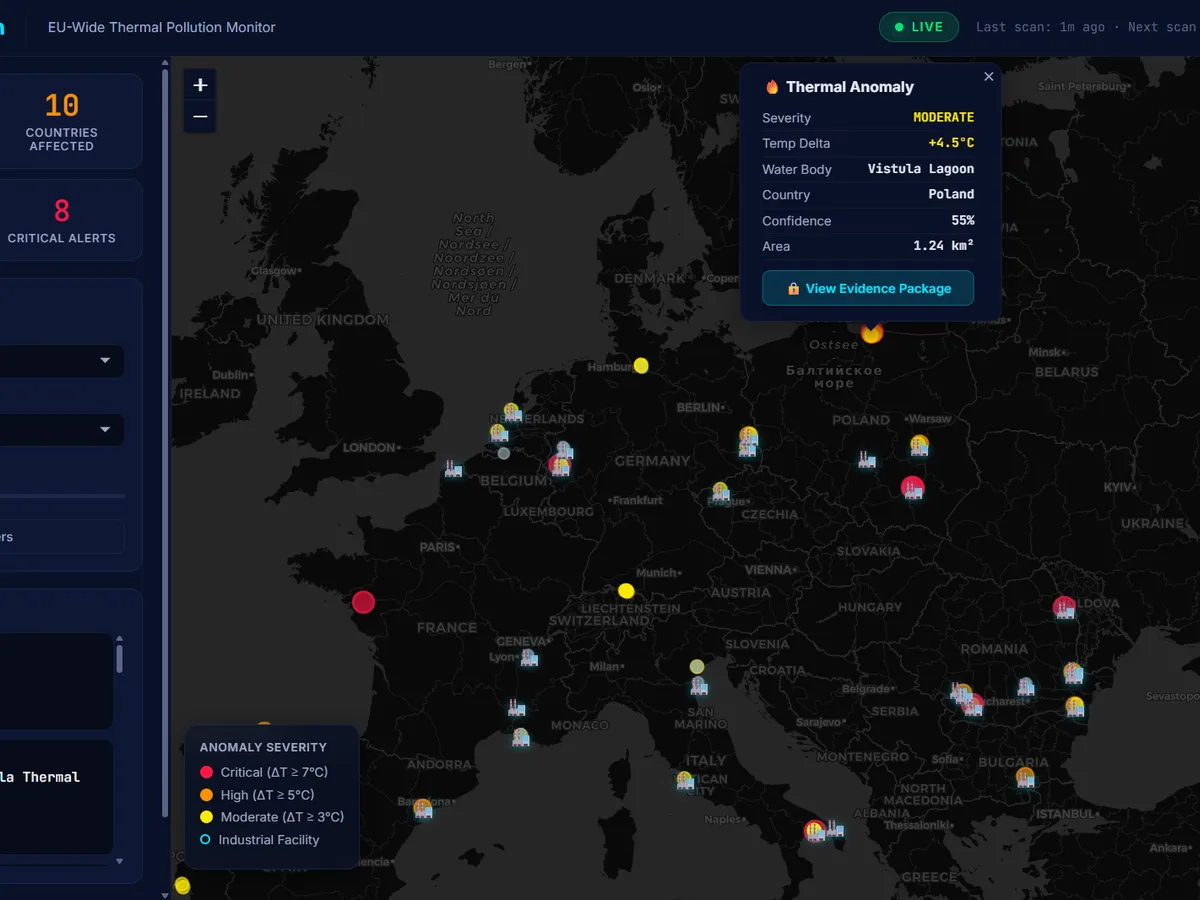
A pipeline that pulls Sentinel-3 SLSTR water-surface-temperature data, flags pixels running hot against their own local neighborhood’s baseline rather than a fixed threshold — water temperature varies by season and location, so a spatial baseline avoids flagging naturally warm areas as suspicious — then clusters connected hot pixels into discrete hotspots and cross-references each against a database of known industrial facilities. Every hotspot gets a confidence score weighted from temperature delta, facility proximity, time of day (thermal dumping is more common at night), and cluster size, then comes out the other end as GeoJSON with a linked evidence record. A Flask API serves it all — filterable by country, severity, and confidence — to a Leaflet dashboard, and falls back to bundled sample data whenever live data isn’t available, so the dashboard always has something to show instead of an empty screen during judging.
What I did
I built the backend: the Sentinel-3 fetch-and-analysis pipeline and the Flask API serving it to the dashboard.
Result
A working demo by the end of the hackathon — the full pipeline runs against real Sentinel-3 data when credentials and network allow, real anomalies come out as scored, located, GeoJSON hotspots, and the dashboard stays populated either way.